Football Field Valuation Analysis
Add a DCF, public comps, and precedent transactions to a completed LBO model to create a new "Football Field" style valuation tab—allowing users to easily compare multiple valuation methodologies side-by-side. To create a new Football Field, click the "+" button next to the "Summary" tab at the top of any completed LBO model. Note that Football Fields can also be added to completed DCF models by using the same "+" button.
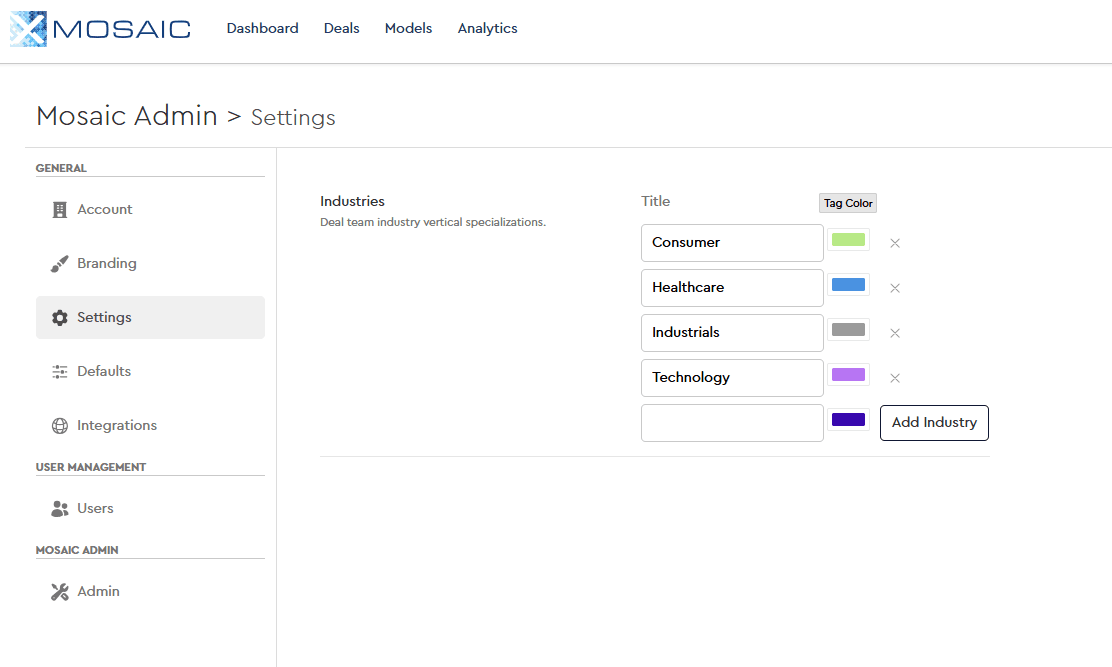
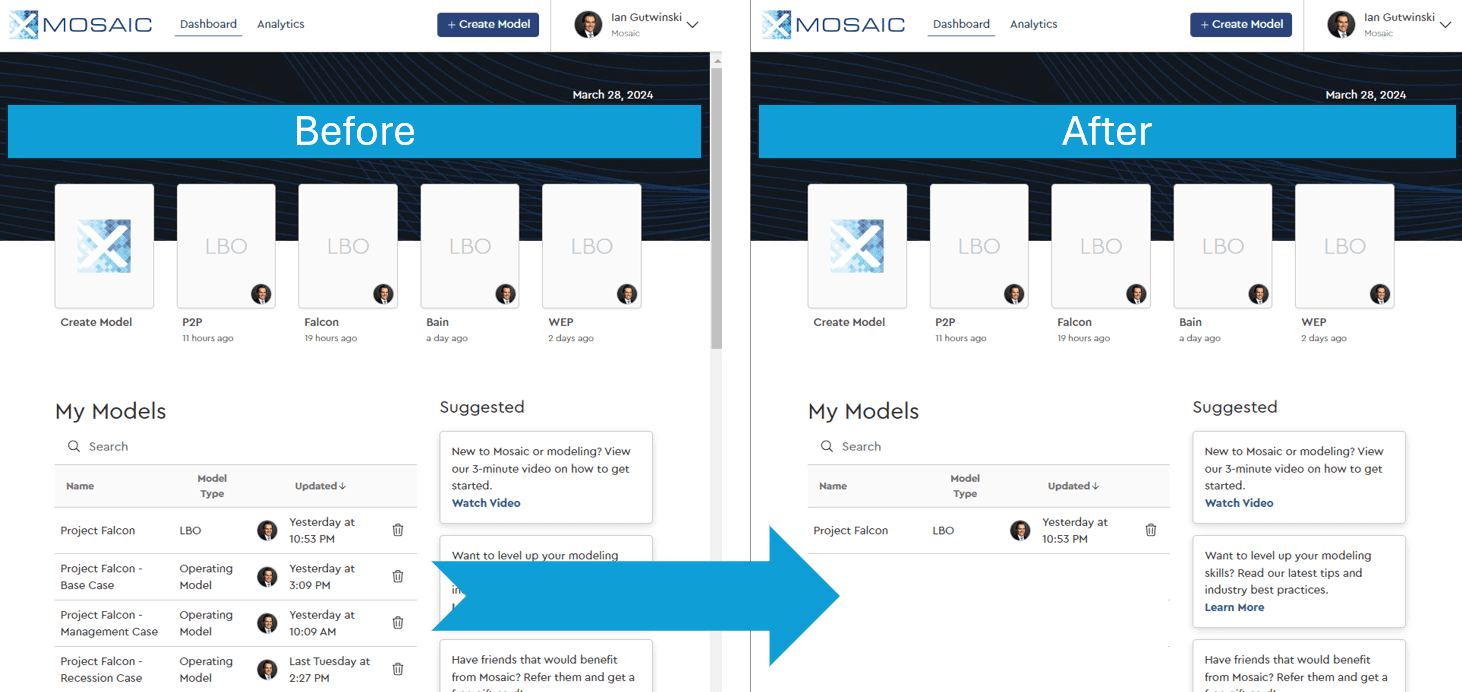
Centralized Deal Workspace
Get a complete picture of every opportunity with Mosaic’s redesigned Deals View. The new experience centralizes all critical deal information in one place, including operating metrics, valuation data, transaction context, financial models, associated documents, and deal team members. With key insights surfaced in a clean, intuitive interface, teams can quickly assess opportunities, stay aligned on key metrics, and access everything they need without jumping between multiple pages or systems.
Upload Documents to Deals
Keep all deal materials organized and accessible with document management directly within the Deals View, accessible by clicking on any deal in the deal library. Users can upload and store a wide range of file types, including PowerPoint presentations, Excel models, Word documents, PDFs, CSVs, and images. Whether it's CIMs, quality of earnings reports, customer analyses, management presentations, financial models, or diligence materials, all relevant documents can be attached to a deal and shared across the team, creating a centralized source of truth throughout the investment process.
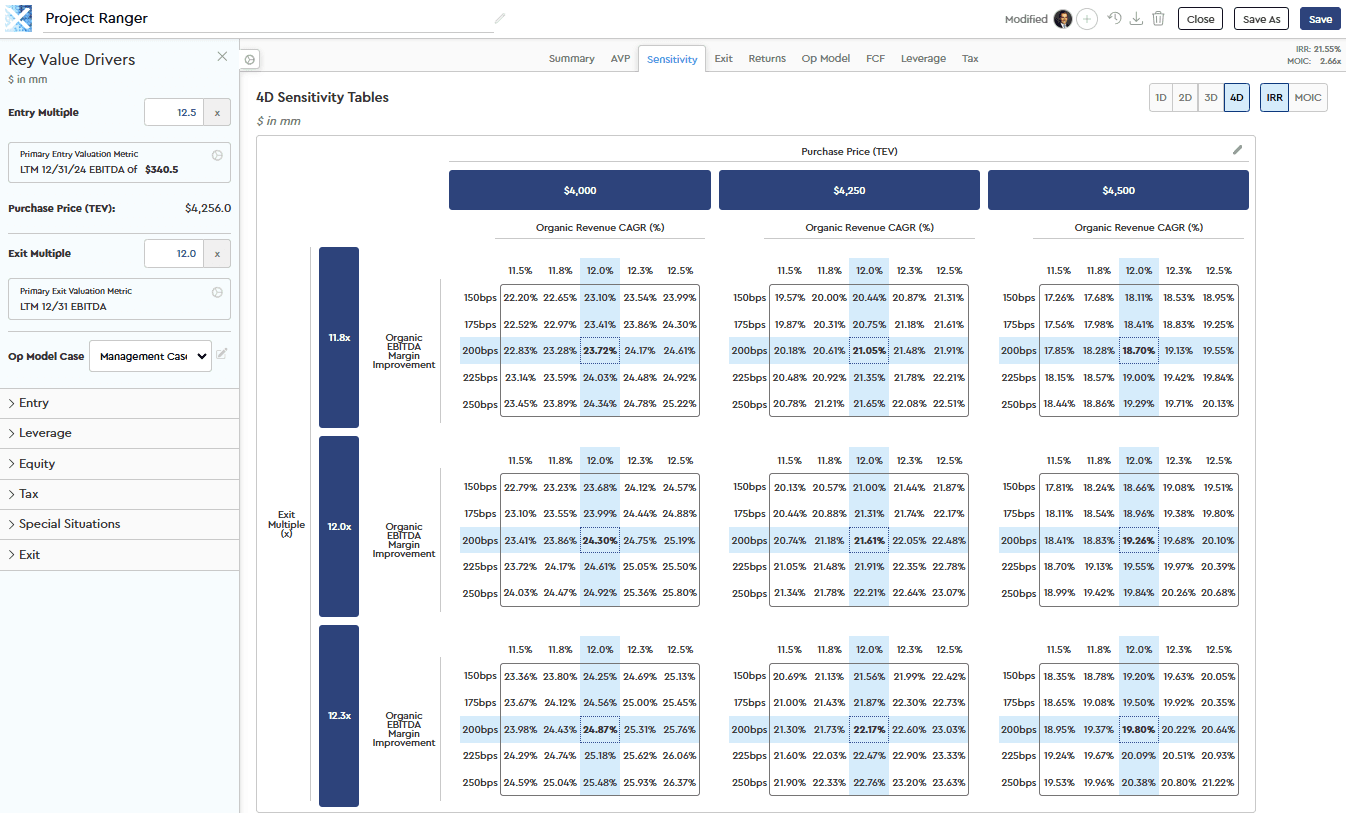
Sensitize Run-rate Cost Savings
Mosaic now supports sensitivity analysis for run-rate cost savings within the “Sensitivity” tab. To sensitize run-rate cost savings, first ensure that the “Cost Savings” special situation is toggled on and input all relevant assumptions. Next, create a new sensitivity table and use the X- or Y-axis dropdown to select “Run-rate Cost Savings”.
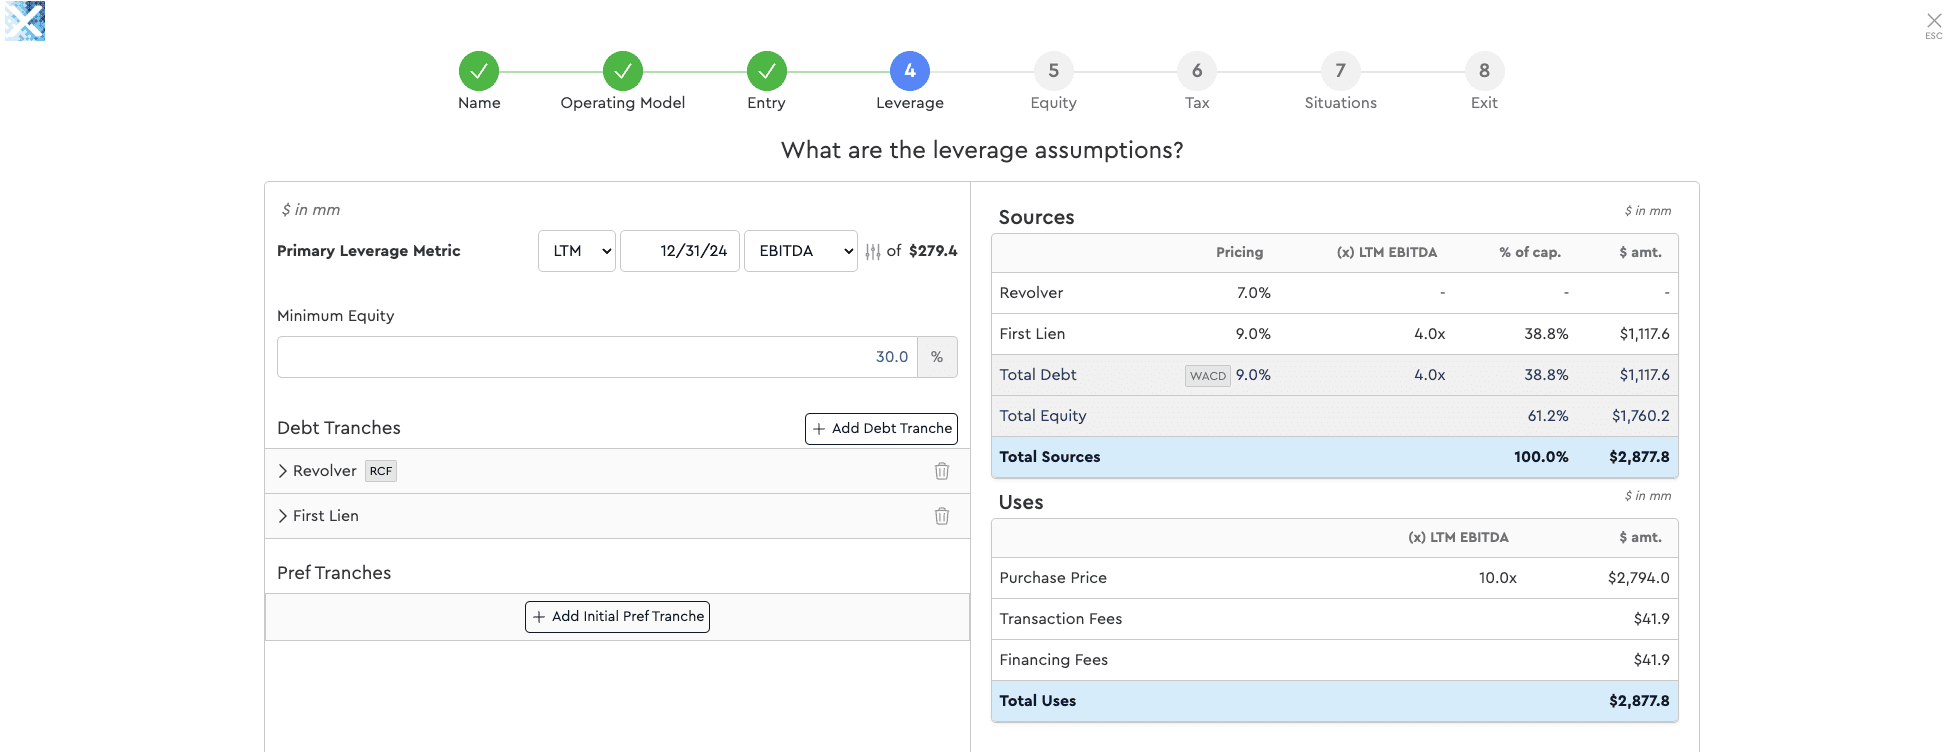
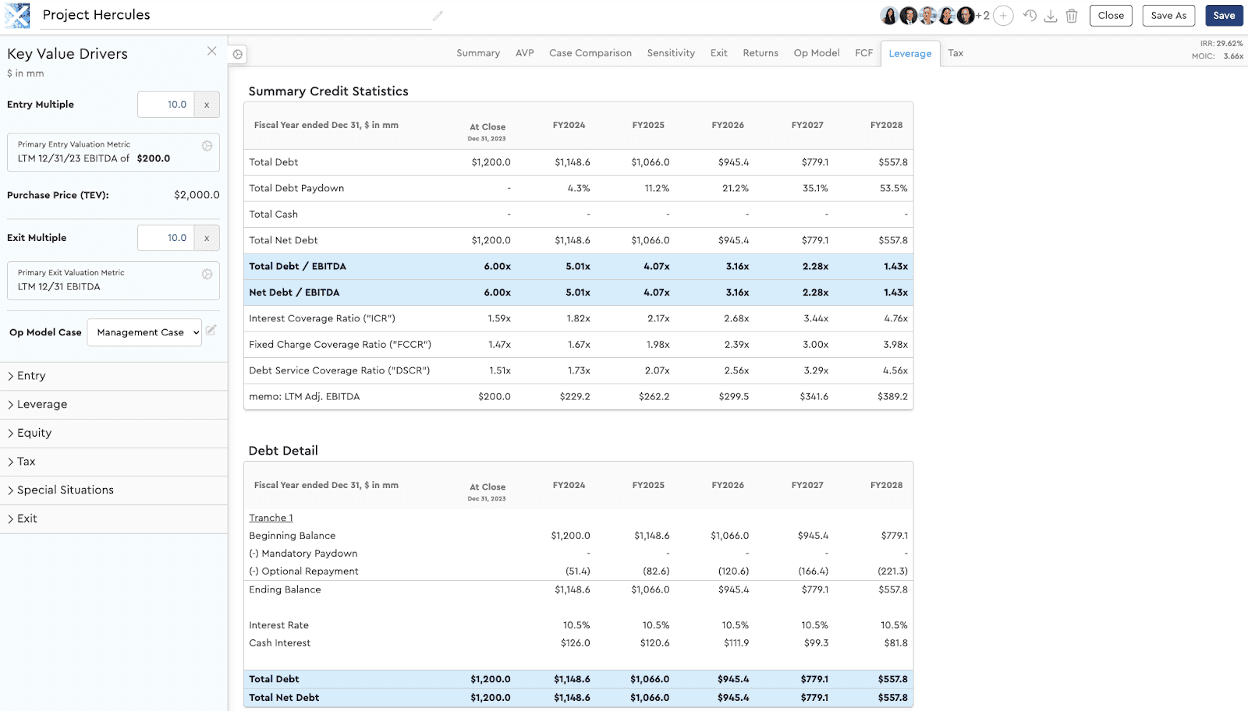
Forecast Leverage and Debt Paydown Visualization
Previously available exclusively in Mosaic’s Credit Investor View, forecast leverage and debt paydown visualization is now accessible directly within the Leverage tab. This enhanced view provides a clear, dynamic representation of projected debt balances and leverage ratios over time, helping users better understand deleveraging trends and evaluate financing assumptions.