Overview
How does $1 deployed into a private equity deal become $2 to $3+ at exit (i.e., 2x to 3x+ Multiple of Invested Capital, or “MOIC”)? There are many paths to create value over an investment hold period, and the MOIC Decomposition (or “MOIC Decomp” for short) is an excellent way to illustrate the path. It is an effective tool for new investment opportunities to articulate what the deal team’s value creation plan is (how it is leveraged in Mosaic), but it is also effective for realized investments as a method of illustrating where the actual money was made ex-post.
The math behind a deal’s MOIC or “cash on cash return” is quite simple: the total dollars returned by an investment, divided by the total dollars contributed to an investment.
The MOIC Decomp is designed to help investors understand which elements of a deal’s value creation the return came from by isolating the dollar impact of each component of return and comparing it to the total invested capital in a deal (i.e., the denominator of the MOIC equation described above).
Investors can attribute overall MOIC to whatever components or subcomponents of return they find helpful for comparing investment opportunities across one another. Standardization of this analysis across all opportunities reviewed is critical to ensure comparability from one investment opportunity to another – which is why we believe this is an excellent candidate for automation through software (complete standardization and elimination of human error in the calculation steps).
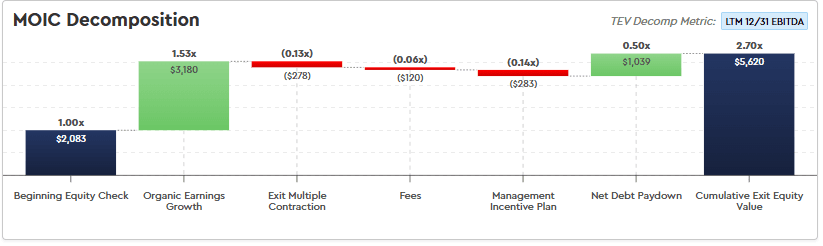
Below are the standard components of an MOIC Decomp produced in Mosaic:
This article discusses the MOIC Decomp analysis conceptually as well as provides (a) an in-depth walkthrough of Mosaic’s automated MOIC Decomp analysis and our philosophy behind the ordering and grouping of subcomponents for comparability across deals, and (b) step-by-step instructions for how to replicate the analysis manually in Excel. Unlike its more sophisticated counterpart (the IRR Decomposition, described in a separate article linked here), the MOIC Decomp a straightforward computation that does not require iteration or “switches” to reproduce it in Excel.
One important note – the methodology embedded within Mosaic is not our invention – but rather a crowd-sourced product of thousands of voices from our user-base of some of the world’s largest and most successful investors and advisors. By transparently publishing our approach without a paywall, we hope to make industry standard and widely understood what was once opaque, tribal knowledge appreciated by only a small group of private equity professionals.
Standard MOIC Decomp Example
A standard Mosaic LBO will produce an MOIC Decomp breaking the deal’s return across the following components as shown in the chart below:
Before we dive into practical complexities, let’s start with a very simple example to illustrate what it means to decompose a metric like MOIC.
Consider an investment with the below metrics at entry and exit. We present a “delta” (∆) column as well to illustrate the change in each value from entry to exit (i.e., exit values minus entry values):
Simple Example MOIC Return
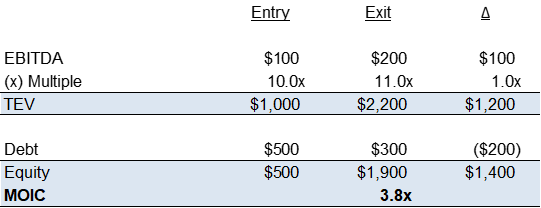
In this example, we have generated a 3.8x MOIC – turning our initial $500 investment into $1,900 over our investment hold period.
A simple way to show this visually would be as follows:
Exhibit A – Total Gain
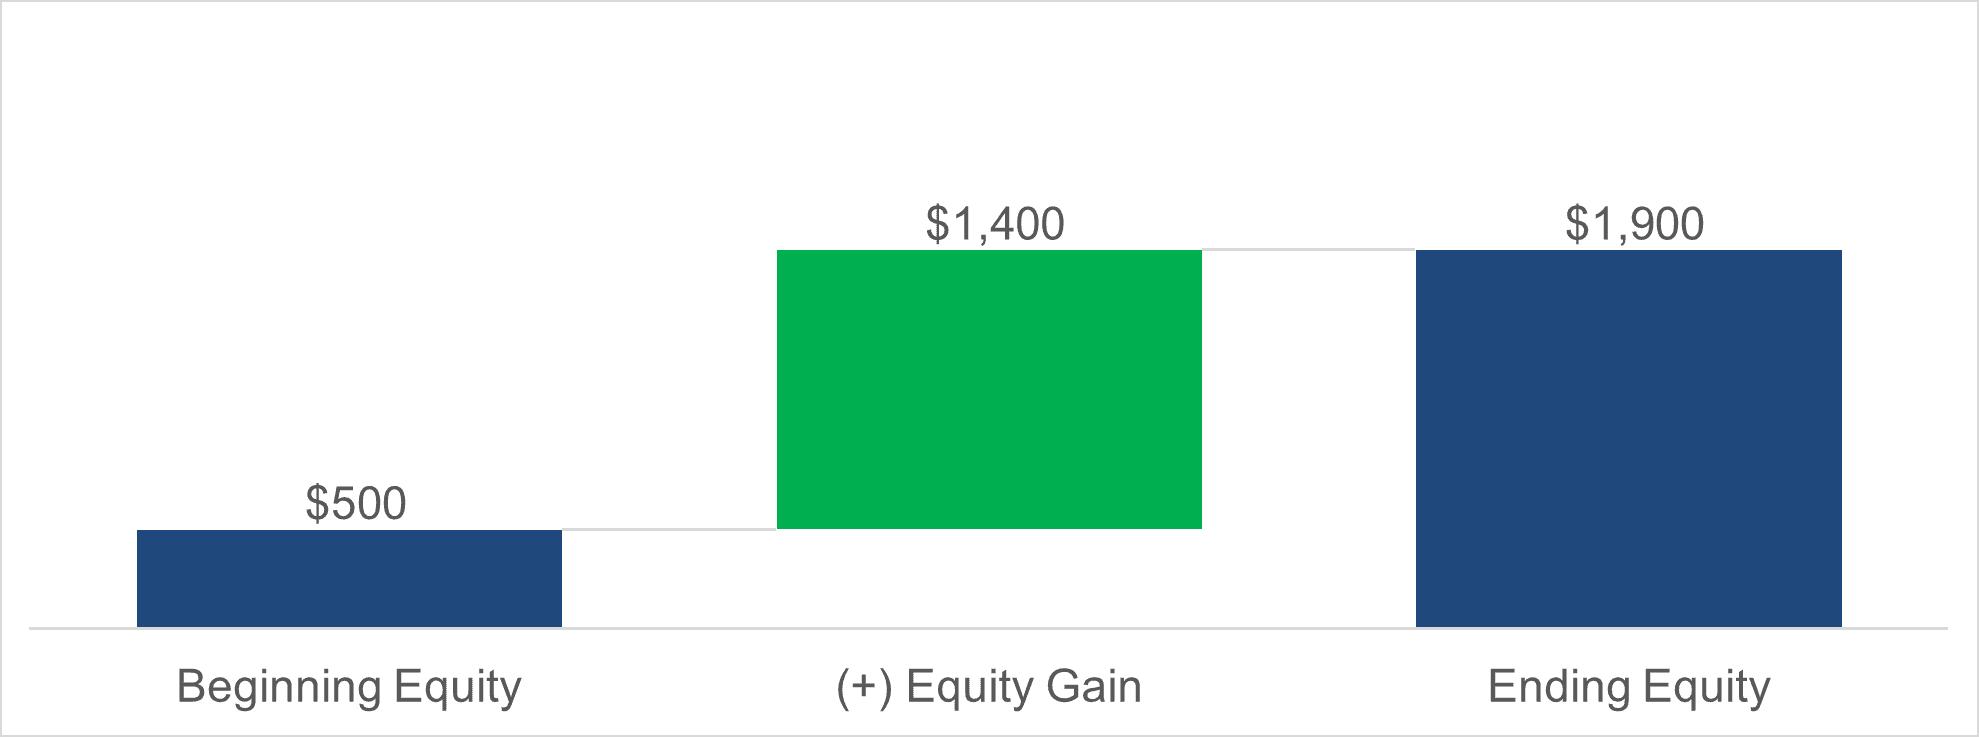
Not a particularly insightful chart.
However, from the table above, we can see this $1,400 of Equity is really comprised of two subcomponents: (1) the fact that TEV increased $1,200 over the hold period, and (2) that Debt decreased by $200 over the hold period (a “good guy” for the equity holders). Separating these components out, we get:
Exhibit B – TEV Growth vs. Debt Paydown
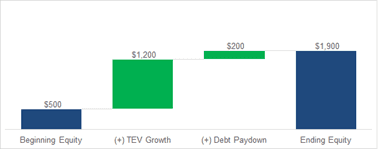
This chart packs in a bit more information than the previous one – now the reader knows: (i) that debt was used in this investment, and some was paid down over the investment hold period, and (ii) that the growth in the value of the business overall contributed the vast majority of value creation.
As we discuss in our note on IRR Decomps, however, there are subcomponents of the growth in TEV that have varying levels of risk to them – recall, exit multiple expansion is difficult to underwrite / rely on, and is therefore worth isolating in any decomposition exercise.
How could we break the $1,200 of total TEV growth into (a) the impact from EBITDA growth, and (b) the impact from multiple expansion? The answer is simple – isolate each factor by holding the other constant, and recalculate.
1. To Isolate the Impact of EBITDA Growth, we Hold the Exit Multiple Constant. How much would TEV grow if there was no change in Exit Multiple?
Instead of:
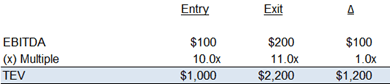
We would have:
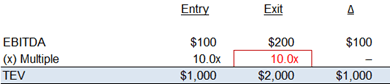
Mathematically, TEV would have grown, in dollars, equal to (Exit EBITDA – Entry EBITDA) x the Entry Multiple, or ($200 - $100) x 10x in our case (= $1,000).
2. To Isolate the Impact of Multiple Expansion, we Hold the EBITDA Growth Constant. The trick to remember here is that the exit multiple expansion applies to the exit EBITDA (i.e., we get the benefit on all the EBITDA at exit).
Instead of:
We would have:
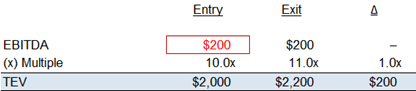
Mathematically, TEV would have grown, in dollars, equal to (Exit Multiple – Entry Multiple) x the Exit EBITDA, or (11x – 10x) x $200 in our case (= $200).
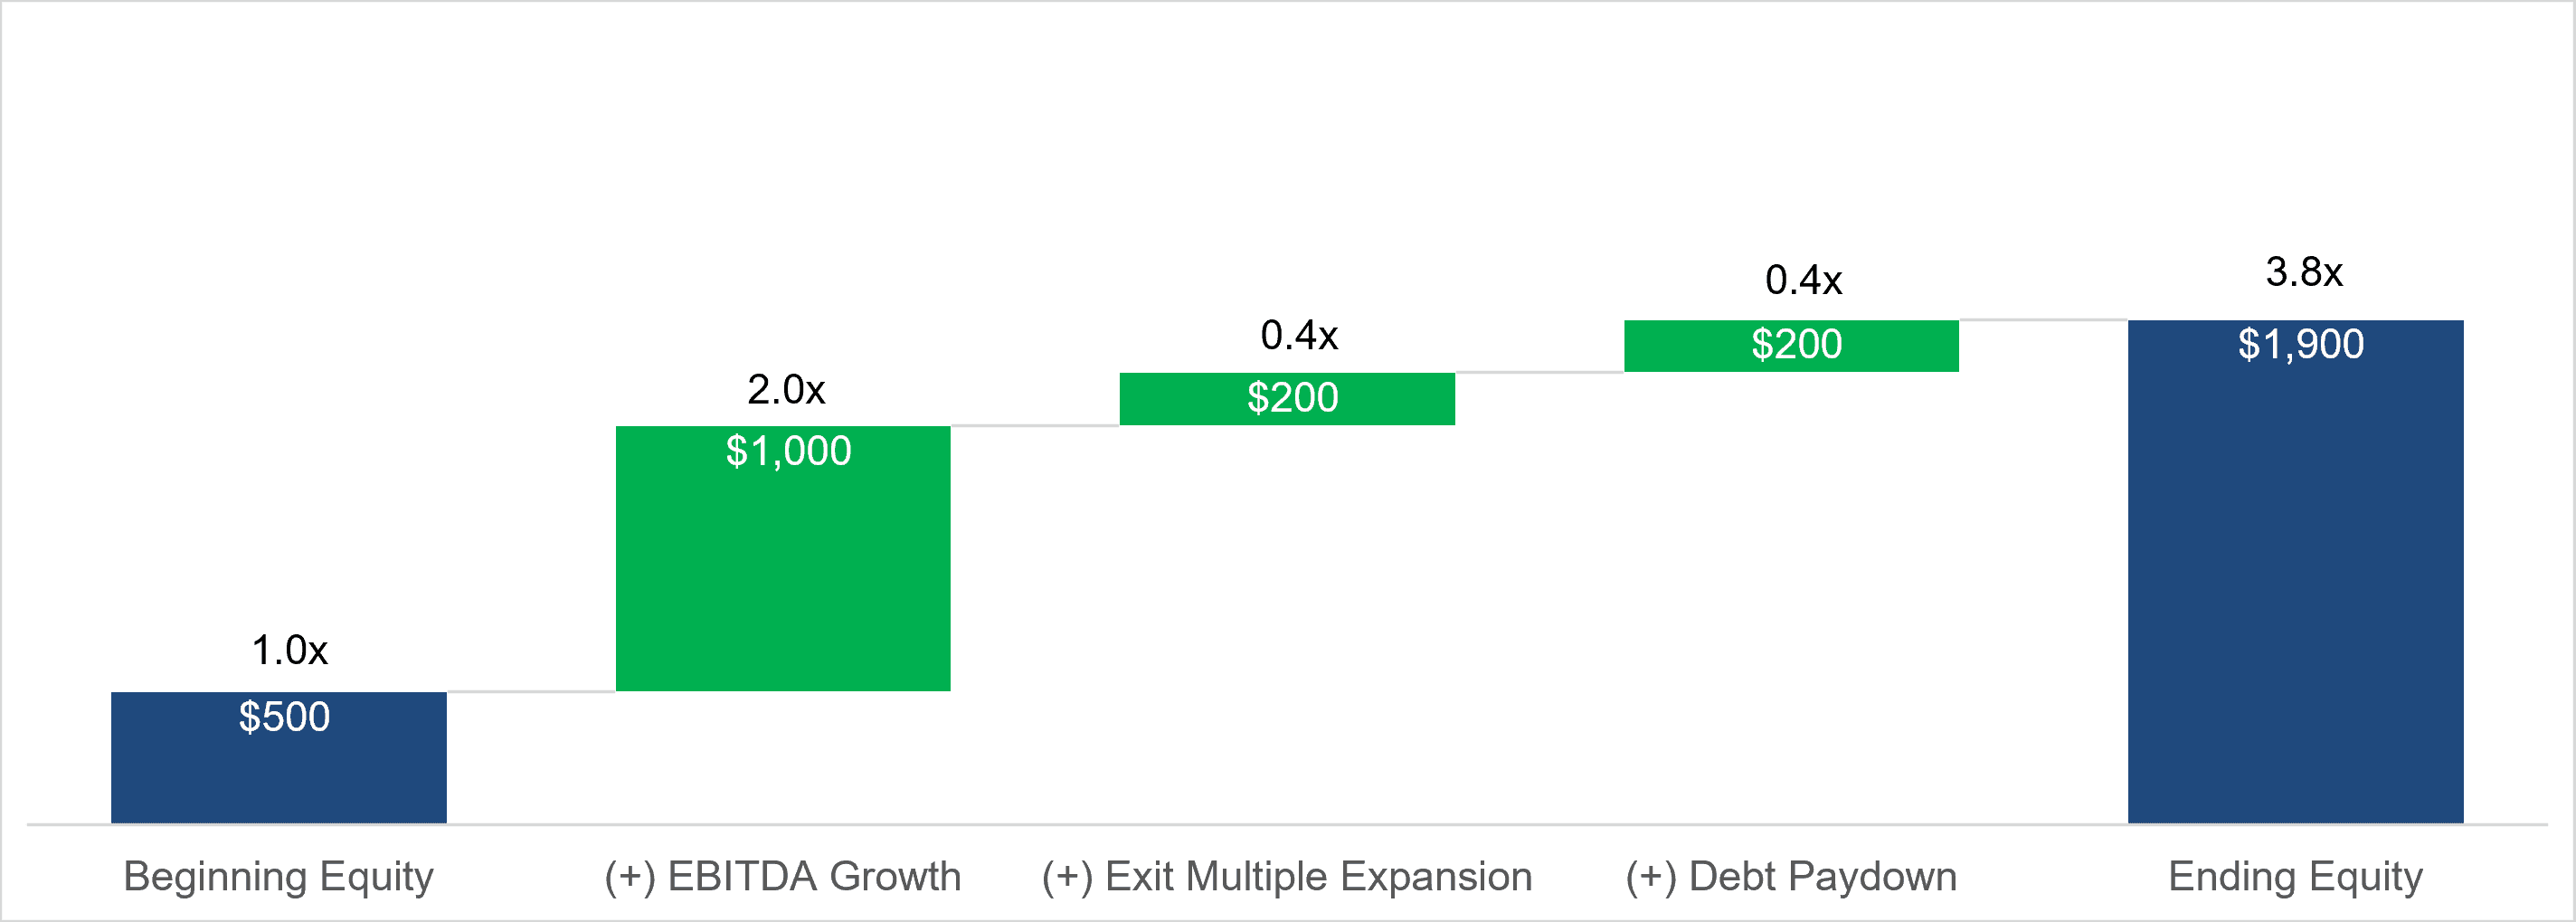
Putting it together, we get a clearer understanding of where our returns have come from – clearly an earnings growth story with modest multiple expansion and debt paydown:
Exhibit C – Decomposing TEV Growth

Finally, it is industry standard to not only compute the dollar impact of each component of return, but also to divide it by the entry equity amount to also state the analysis on a Multiple of Investment Capital, or MOIC, basis as follows:
Exhibit D – Simple MOIC Decomp
MOIC Decomps in Practice
In practice, MOIC Decomps are never as simple as the illustration above. There are several complexities that arise when “special situations” like M&A are included in a model or if additional equity must be funded during the investment hold period.
Mosaic’s MOIC Decomp is pre-wired to handle the below situations, and is updated regularly as our user base of thousands of private equity professionals constantly invents new ways of creating value (and want to see it reflected in our bridges). Alongside each component, we provide a description of it and a guide for how to calculate it in Excel. Recall that all Mosaic models are downloadable into Excel with dynamic decompositions that can be reviewed as a resource alongside this note.
Section 1 – Equity Contributed (MOIC Denominator)
Value Component | Calculation / Formula | Description |
|---|---|---|
Beginning Equity Check | Link to Total Common Equity Check in the Sources & Uses. | The initial equity contribution is the starting point of the Bridge. If there’s no further equity capital contributed, this will be the “1.0x” base for your MOIC Decomp. |
(+) Hold Period Equity Issuances | Sum of all equity injections across organic and M&A-related rows in the returns table. | Equity contributed post close to fund (a) operating losses or (b) M&A not funded by ongoing cash flows or debt. Because this is also invested capital, it is additive to the MOIC denominator. |
Total Equity Contribution | The sum of the two lines above. Not required if no Hold Period Equity Issuances are present. | The sum of all equity contributed by the sponsor over the course of the deal (i.e., beginning equity check plus all hold period equity issuances). When it exists, this becomes the “1.0x” base for your MOIC Decomp and the Beginning Equity Check will therefore be less than 1.0x. This is displayed as a “total” type step in the Decomp bridge chart. |
Section 2 – Organic TEV Growth
Value Component | Calculation / Formula | Description |
|---|---|---|
Organic Earnings Growth | (Organic Exit Earnings - Entry Earnings) (x) Entry Multiple | Entry and exit valuations are almost always framed as a multiple (or yield, which is just the inverse of a multiple) of some “Earnings Metric” (Revenue, EBITDA, EBITDA less Capex, etc.). As such, the key element of the decomposition is attributing how much of the growth of total enterprise value comes from the earnings growing vs. the multiple changing from when we bought the business to when we sold. It is important for this step to frame the Organic Earnings Growth around whatever Earnings Metric you are basing your entry and exit valuations on (i.e., such that the Multiple Expansion or Contraction impact is apples-to-apples to this element of the Decomp). Failing to synchronize these components will lead to an MOIC Decomp that does not tie to your overall LBO MOIC. We also emphasize here using Organic metrics at exit (i.e., excluding any benefit from M&A and Cost Savings, or any reduction from Sale Leasebacks) to appropriately isolate the impact from those value creation elements in separate steps of the decomposition. |
Multiple Expansion or Contraction | (Exit Multiple – Entry Multiple) (x) Exit Earnings | Did the valuation multiple increase or decrease from the time of acquisition to exit? This step attributes a dollar gain to that fact to clearly communicate to the reader (a) whether multiple expansion or contraction is assumed (or was achieved) and (b) the order of magnitude impact to the overall value creation. |
Section 3 – Net Debt Paydown
Value Component | Calculation / Formula | Description |
|---|---|---|
Debt Paydown / Cash Accumulation | Entry Net Debt – Exit Net Debt | MOIC Decomps discussed in this article are analyses of returns to equity holders only. Equity value is simply what’s left of total enterprise value after all debt-like obligations are settled. As such, paying down debt (using cash flows from the business) directly increases the common equity value dollar for dollar. As a reminder, cash is subtracted from debt to arrive at “net debt,” the figure we use here to compute the value creation from debt paydown. In company valuation, cash can be thought of as “negative debt,” as it can be used to offset / retire debt. If an investment is made on an “unlevered” basis (i.e., no debt), then any cash generated by the business and not paid out as a dividend will be left on the balance sheet and will increase the value available to equity holders above and beyond the total enterprise value of the business. Remember that a negative net debt balance simply means a positive cash position – as such, the math for computing this step in the MOIC Decomp does not change whether we’re dealing with positive or negative net debt positions at entry or exit. |
Section 4 – Dividends / Distributions
Value Component | Calculation / Formula | Description |
|---|---|---|
Dividend Sweep | The sum of all dividends paid to equity holders via the sweep mechanism over the investment hold period. | Cash dividended from the business during the investment hold period to equity holders is counted towards the total realized capital from the investment and therefore must be given credit in the MOIC Decomp. Because the cash leaves the system (i.e., is not held on the balance sheet until exit), failing to count it as a separate bridging item in the MOIC Decomp would understate the overall return relative to the modeled MOIC from the LBO. |
Tax Distributions | The sum of all tax distributions paid to equity holders as part of a flow-through tax entity’s compliance obligations. | Mathematically the same as the Dividend Sweep above, Mosaic breaks this out separately to delineate required distributions (i.e., cash needed to fund LPs tax obligations) vs. discretionary dividend payments (i.e., sweep). |
Section 5 – Management Incentive Plan & Fees
Value Component | Calculation / Formula | Description |
|---|---|---|
Management Incentive Plan | Link to the net proceeds to management related to the Management Incentive Plan. | This represents the net proceeds paid to the management team under an incentive plan meant to align financial interests of the private equity sponsor and the individuals running the operations day to day. |
Fees | The sum of: (a) transaction fees at entry, (b) financing fees at entry, and (c) transaction fees at exit. | Fees paid to lawyers, accountants, and investment bankers to get the deal done – at entry, and at exit. Unlike the IRR Decomp which distinguishes between levered and unlevered returns, the MOIC Decomp is simpler and bundles all fees together (i.e., Transaction Fees and Financing Fees). |
Section 6 – Mosaic Special Situations
Value Component | Calculation / Formula | Description |
|---|---|---|
Cost Savings | Cost Savings EBITDA Impact at Exit x Exit Multiple | Recall that in our attribution of value to EBITDA growth, we used Organic EBITDA at exit. This was so we could appropriately attribute the impact of cost savings plays in the decomposition analysis. At this step, we take the total EBITDA attributable to the cost savings play at exit and multiply it by the exit multiple to arrive at the value creation from cost savings. Note: if the valuation metric you’re framing your decomp on is not Revenue, cost savings should not be broken out in your decomp, as they will not impact the revenue metric at exit (only EBITDA-derivative metrics). |
Sale Leaseback | Sale Leaseback Rent at Exit x Exit Multiple | Similarly to Cost Savings as described above, here we isolate how much enterprise value was lost by increasing rent (and reducing EBITDA) from the Sale Leaseback transaction. Note: if the valuation metric you’re framing your decomp around is Revenue, the sale leaseback impact should not be broken out in your decomp, as it will not impact the revenue metric at exit (only EBITDA-derivative metrics). |
Exit Tax Shield | Link to the Proceeds from Sale of Tax Shield at Exit. | For assets that have significant tax shields, not all available amortization may be used over the hold period, and thus future tax shield may be available to the next buyer of the business. In these cases, some private equity firms are able to sell the remaining tax shield at exit (over and above the TEV of the business). In such cases, we must capture the proceeds from such sales in the MOIC Decomp as an additional source of value. |
M&A | M&A Earnings at Exit x Exit Multiple | Be sure to match your valuation metric in producing the decomposition for this step. Unlike Cost Savings and Sale Leasebacks, M&A does indeed contribute to Revenue as well as EBITDA, and thus is relevant to decompose regardless of the exit valuation metric being used. |
NTM M&A Spend | Link to the NTM M&A Spend adjustment in the exit schedule. | As a reminder, if you’re running a case with M&A, and exiting off of an NTM Exit multiple, Mosaic makes a necessary adjustment to the exit waterfall to “pay” for acquired EBITDA benefitting the exit value – for which no M&A spend would exist in the final year of the model. In order for the bridge to tie to the model in this scenario, we must include the adjustment in the bridge as well. |
Dividend Recap | Link to Net Cash Raised in Dividend Recap. | The Dividend Recap creates a hold period distribution to equity holders, and thus must be treated as a return of capital exactly like dividends / distributions above. From the gross debt raised, we subtract fees associated with the recap to get to net proceeds paid to the equity holders. Note that the debt increases as a result of a dividend recap, reducing equity value dollar for dollar, which will be captured in the Net Debt Paydown component described above. |
Section 7 – Edge Cases
Value Component | Calculation / Formula | Description |
|---|---|---|
Equity Funded Operating Losses | Sum of all sponsor equity injections over the hold period that are not related to M&A. | If the business is losing money so significantly that you need to put in more equity to fund it (above and beyond cash on hand or revolver capacity such that this can’t be reflected in net debt), you’ll show both an addition to the MOIC decomp as hold period equity issuances (up above), but also a reduction for the amount that was lost (value destruction). |
Preferred Equity Accretion | The sum of any Paid in Kind (“PIK”) interest accrued to the principal of the Preferred Equity tranches in your model. | Preferred securities are not typically prepayable, but they may accrue interest over an investment hold period, making their value at exit higher than their value at entry. You can think of this as a negative debt pay down – as the value of the preferred accretes, those dollars of accretion reduce the enterprise value that would otherwise go to equity holders at exit. |
Summary
In summary, the MOIC Decomp is a helpful companion analysis to the MOIC produced by a standard LBO because of the context it provides about the investment and its sources of opportunity and risk relative to other investment opportunities available today or that have been reviewed in the past. From the above, we can also see that while it is simple in concept, its implementation can be quite complex depending on the investment situation. Inexperienced modelers will frequently miss or skip steps in the MOIC Decomp, or forget some of the less-than-intuitive math required to decompose certain subcomponents – often leaving ending MOIC values in their decompositions that do not match their overall LBO. It’s also a perfect example of the case for greater automation and standardization of the modeling workstream. While the output of the MOIC Decomp is extremely helpful for deal professionals to consume, its production is a painful, time-consuming exercise in Excel. Time, we’d argue, that’s better spent on commercial due diligence to support or refute the individual components of return you’re underwriting in a given deal, when its automation is readily available in a platform like Mosaic.