Platform Updates: July 2026
Mosaic Introduces the Accretion / Dilution Model
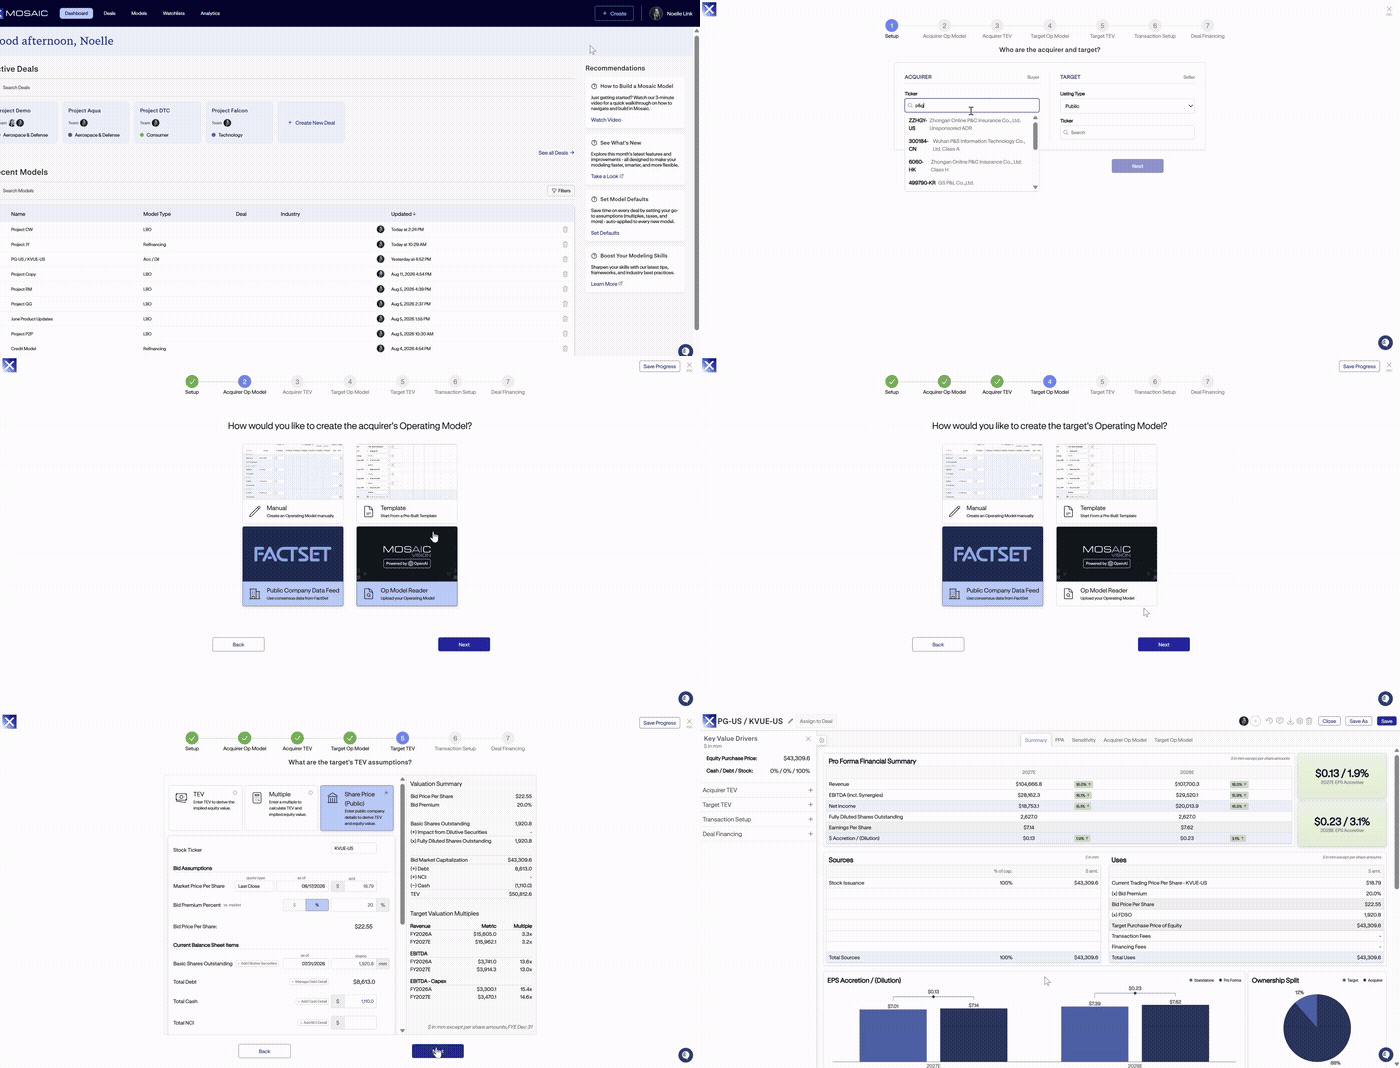
Mosaic now supports a new Accretion / Dilution Model (“Acc / Dil”), giving users a purpose-built framework to evaluate the earnings impact of an acquisition. With Mosaic’s FactSet or Cap IQ integration, users can quickly build a streamlined model that incorporates acquirer and target operating forecasts, synergies, purchase price allocation, and deal financing assumptions. To create an Acc /Dil model, navigate to the Create dropdown on the homepage and select Acc / Dil under Build model types.
1 – Evaluate Public and Private Targets. Model acquisitions of either public or private targets. For public targets, users can pull the latest historical and consensus forecast data directly from Cap IQ or FactSet.
2 – Build Flexible Operating Models and TEV. Both the Acquirer and Target operating models can be built in 4 ways: manually, from a template, with consensus data, or through Mosaic Vision, providing the ultimate flexibility in constructing your operating build. The Acc / DilModel also supports a full build down to Net Income, giving users a complete view of pro forma earnings impact.
TEV can similarly be built manually or populated using public market data, giving users the flexibility to customize individual assumptions or quickly pull the latest available figures.
3 – Model Synergies and Purchase Price Allocation. Incorporate cost synergies by defining run-rate cost savings and the period over which those savings phase in. Users can also model purchase price allocation by setting PP&E write-ups and depreciation, as well as intangible asset step-ups and amortization.
4 – Refinance or Roll Over Target Debt. Users can choose to refinance or roll over a target's existing debt within the model, allowing the capital structure of the combined entity to reflect deal-specific financing decisions.
5 – Customizable Acc / Dil Sensitivities. Within acc/dil sensitivity tables, users can sensitize EPS, $ Acc / (Dil), % Acc / (Dil), and Breakeven Synergies, with the flexibility to select the year shown for each output metric.
New Analytics & Reporting Capabilities
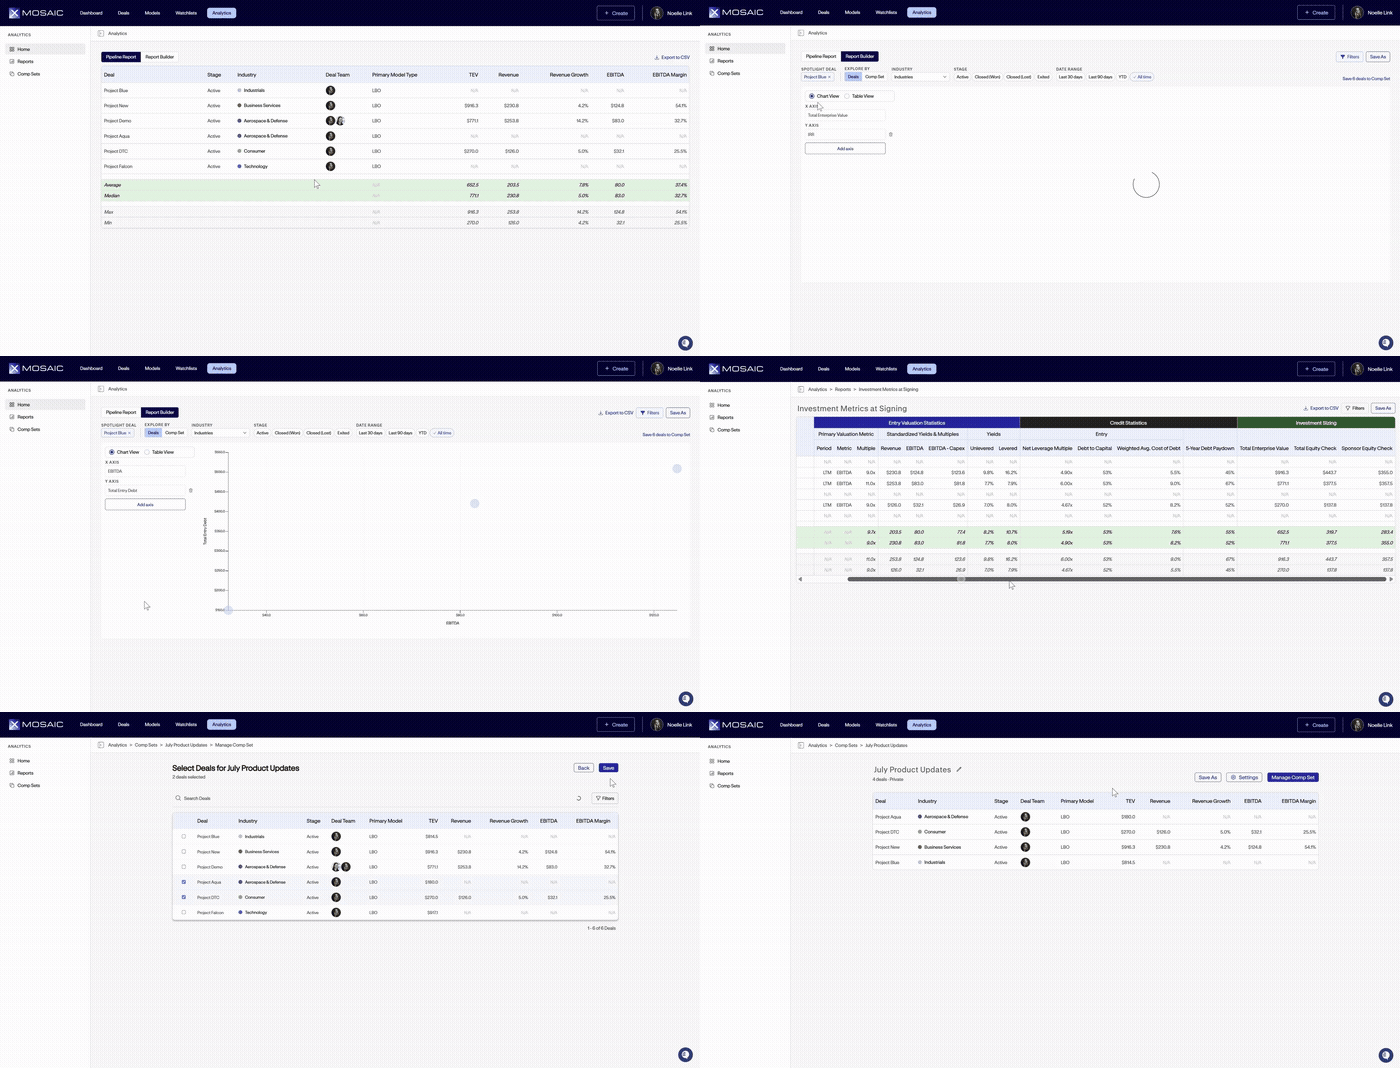
The Analytics tab has been reorganized into three dedicated views: Home, Reports, and Comp. Sets—making it easier to navigate between high-level portfolio insights, custom reporting, and comparable company analysis in a single view.
1 – Build Custom Reports to Compare Deals Side-by-Side. Use “Report Builder” within the Home tab to create custom charts and tables comparing deals across industries, stages, and dates. Users can also define custom X- and Y-axes to tailor each analysis. Note that Report Builder replaces the legacy Analytics tab.
2 – Find and Manage Reports in One Place. View and search previously created reports from the “Reports” tab, with filters for ownership, visibility, and date range.
3 – Create Custom Comp Sets from Previous Deals. Use the Comp Sets tab to group previously created deals and compare key metrics side-by-side, including TEV, Revenue, Revenue Growth, EBITDA, and EBITDA Margin. Comp sets can be shared with other members of the deal team or kept private.
Immediate Data Entry in the Operating Model
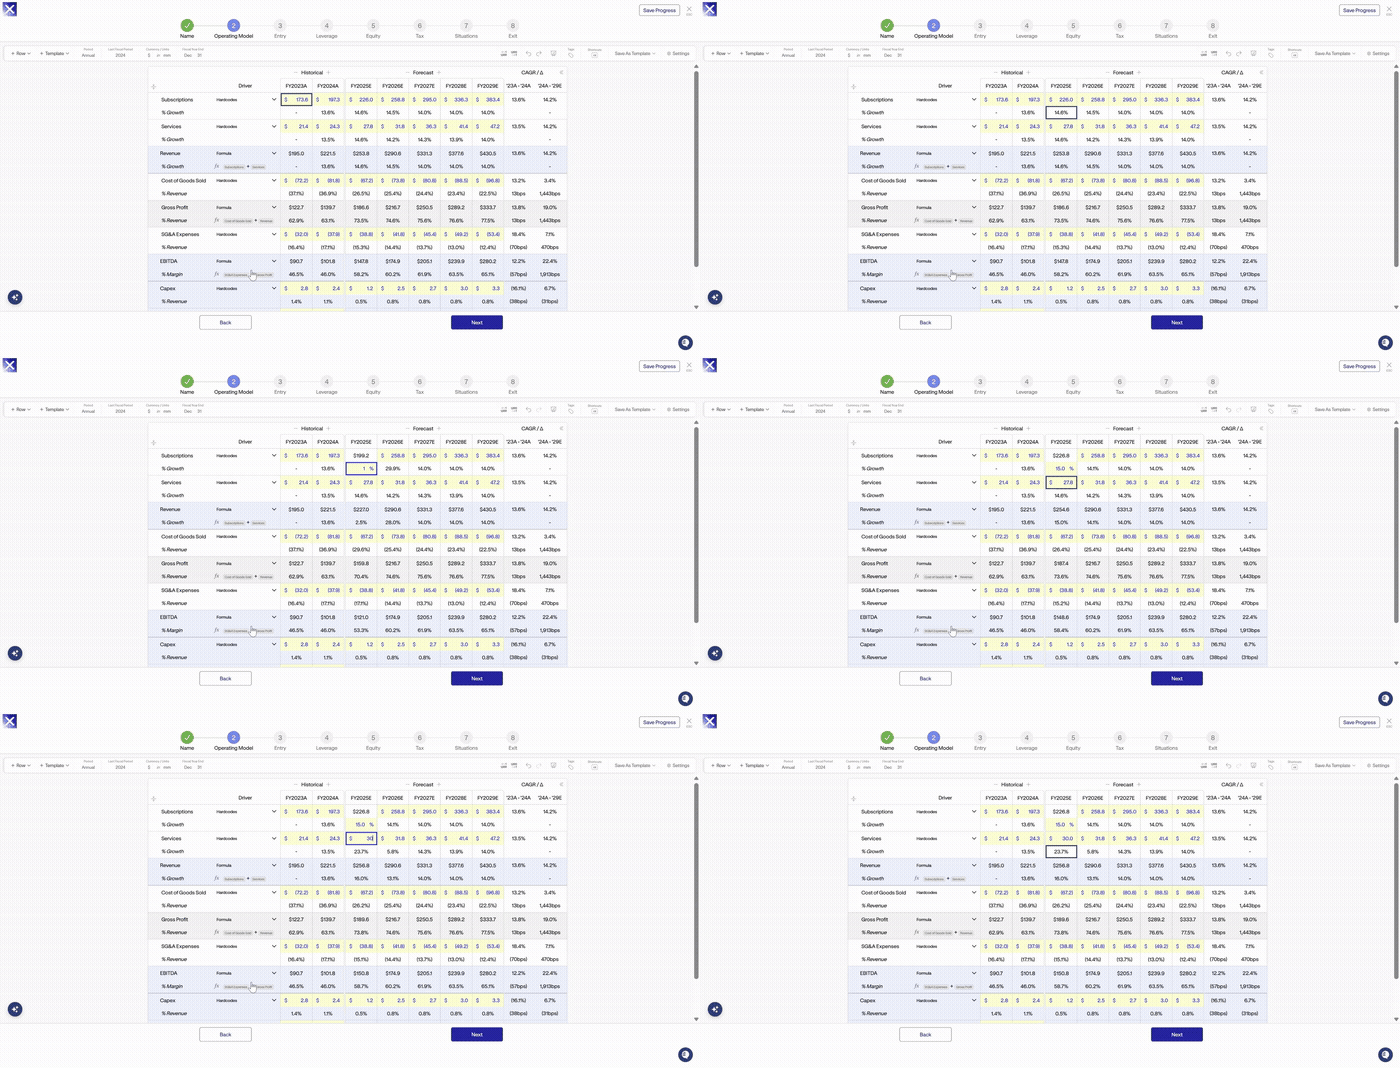
Building operating models is now even faster. Previously, users had to hit F2 to begin editing a cell, now, users can simply start typing directly into any cell to enter or overwrite a value.
Multiple Reference Lines in Football Field Charts
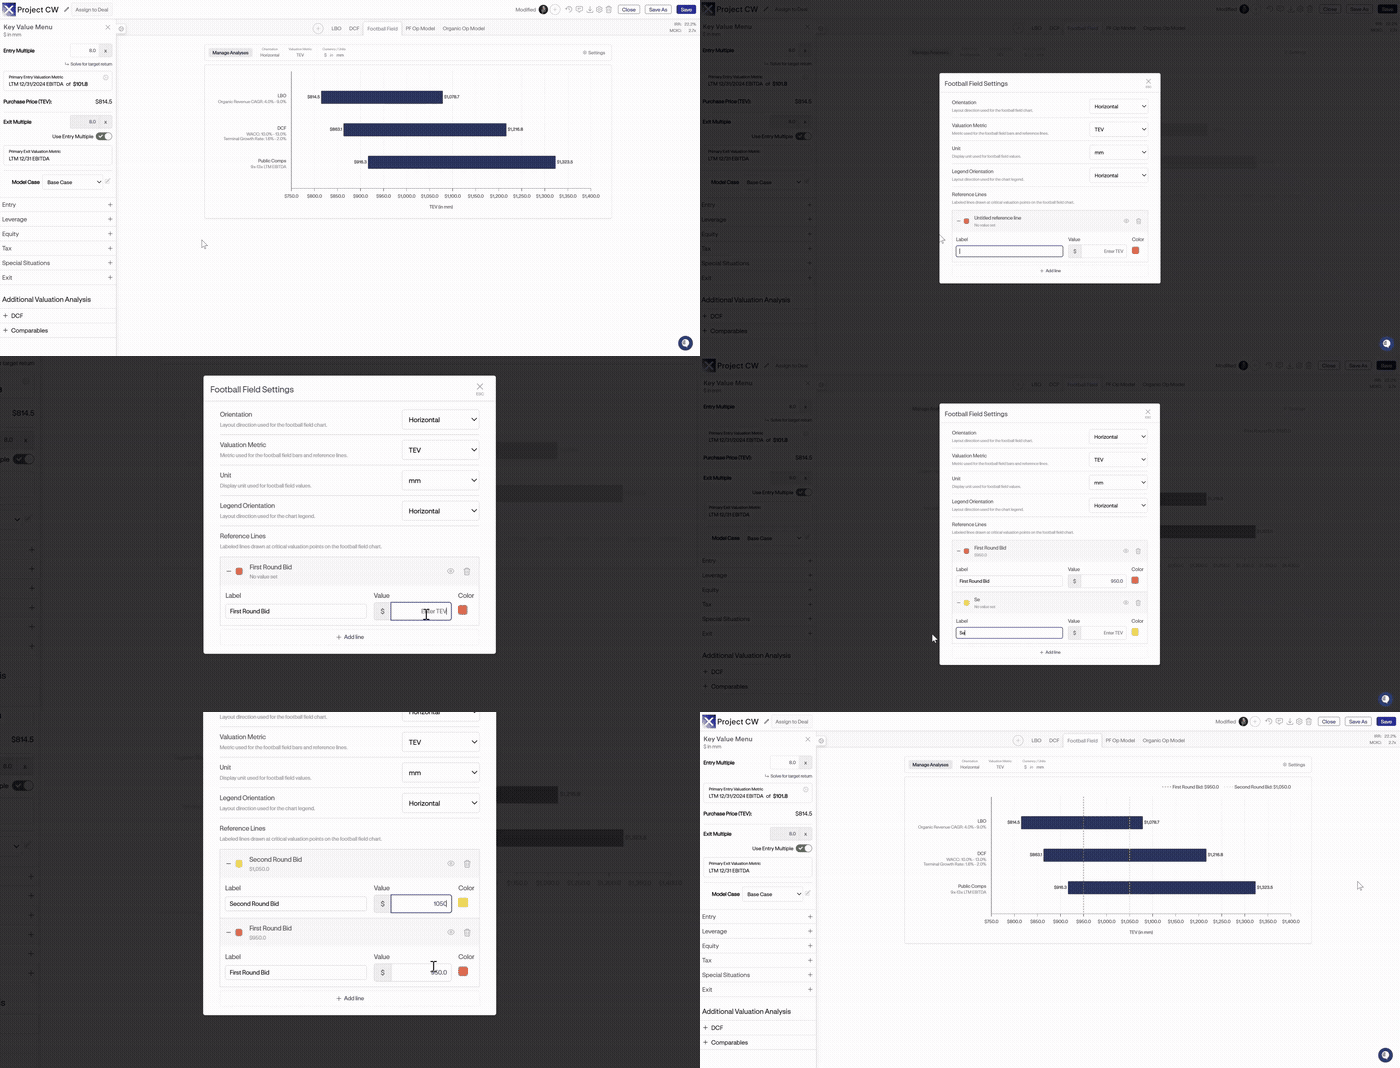
Football Field valuation charts now support multiple reference lines, making it easier to compare valuation methodologies against multiple benchmarks, such as transaction prices or other key valuation thresholds.
Mosaic Launches the Investment Scorecard
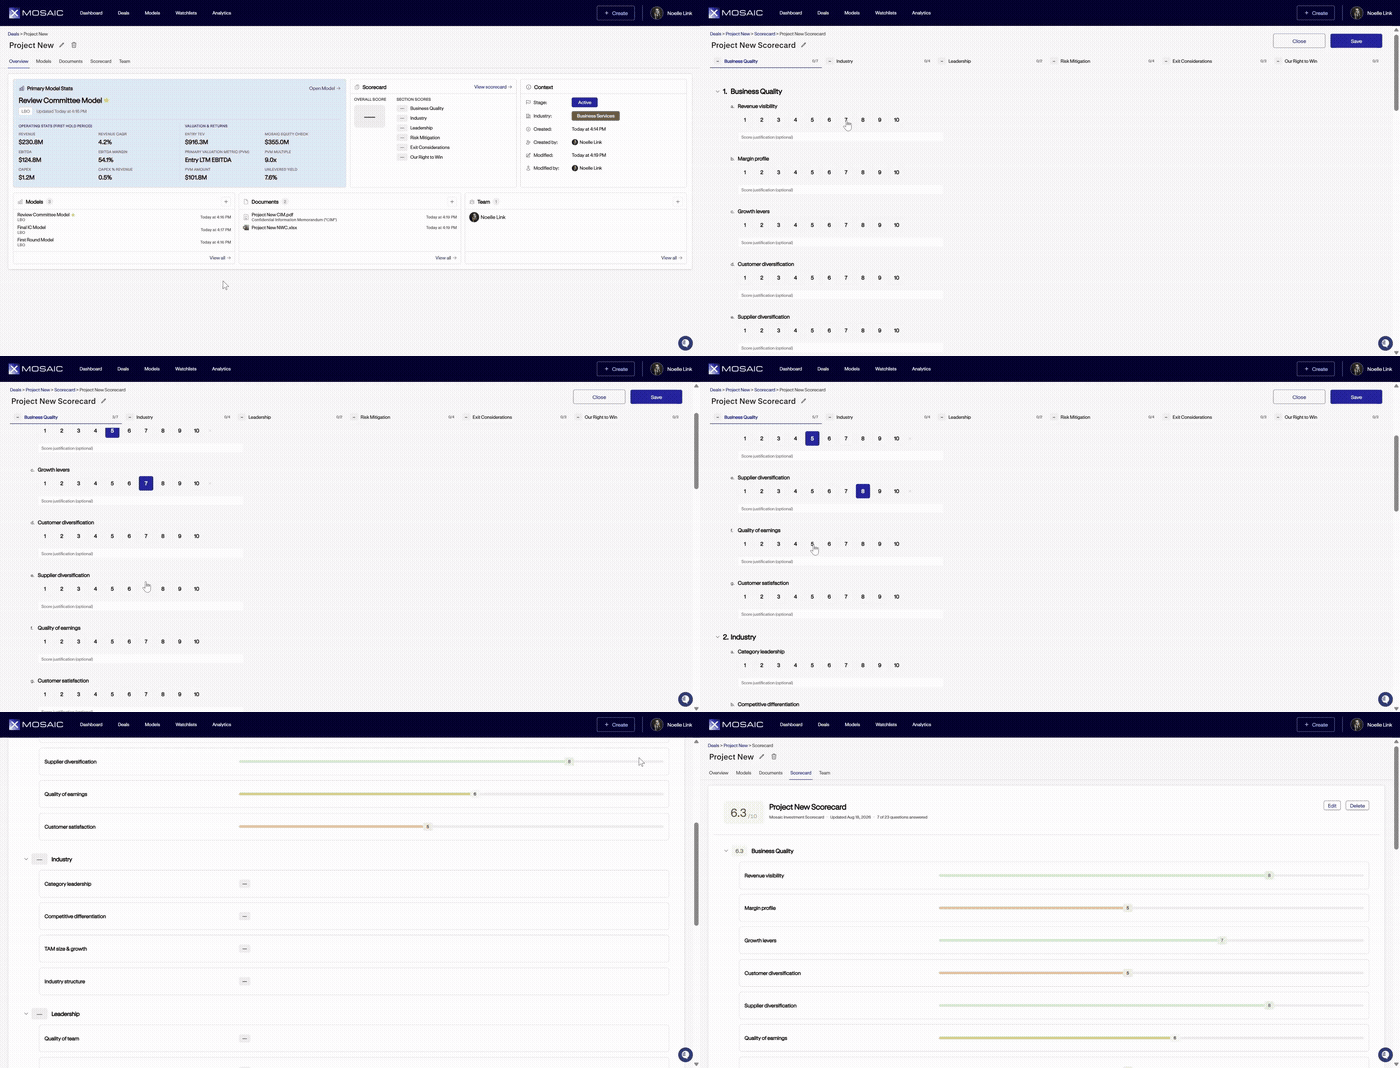
Mosaic now supports a Scorecard for evaluating deal quality. By default, the Scorecard includes six categories: Business Quality, Industry, Leadership, Risk Mitigation, Exit Considerations, and Right to Win.
Within each category, users can manually assign a score out of 10 to individual underlying metrics. The category score is calculated as the average of its underlying metric scores, and the total Scorecard score is the average of the six category scores—giving teams a consistent, structured way to evaluate and compare deals side by side. Organizations can also customize the Scorecard to reflect their own investment strategy and evaluation criteria—including the categories, the investment attributes within each category, and the scoring system itself.
For example, within Risk Mitigation, users can score underlying metrics like cyclicality, regulatory exposure, technology disruption, and key person risk, with the category score reflecting the average across all four.
Comments Now Supported Throughout the App
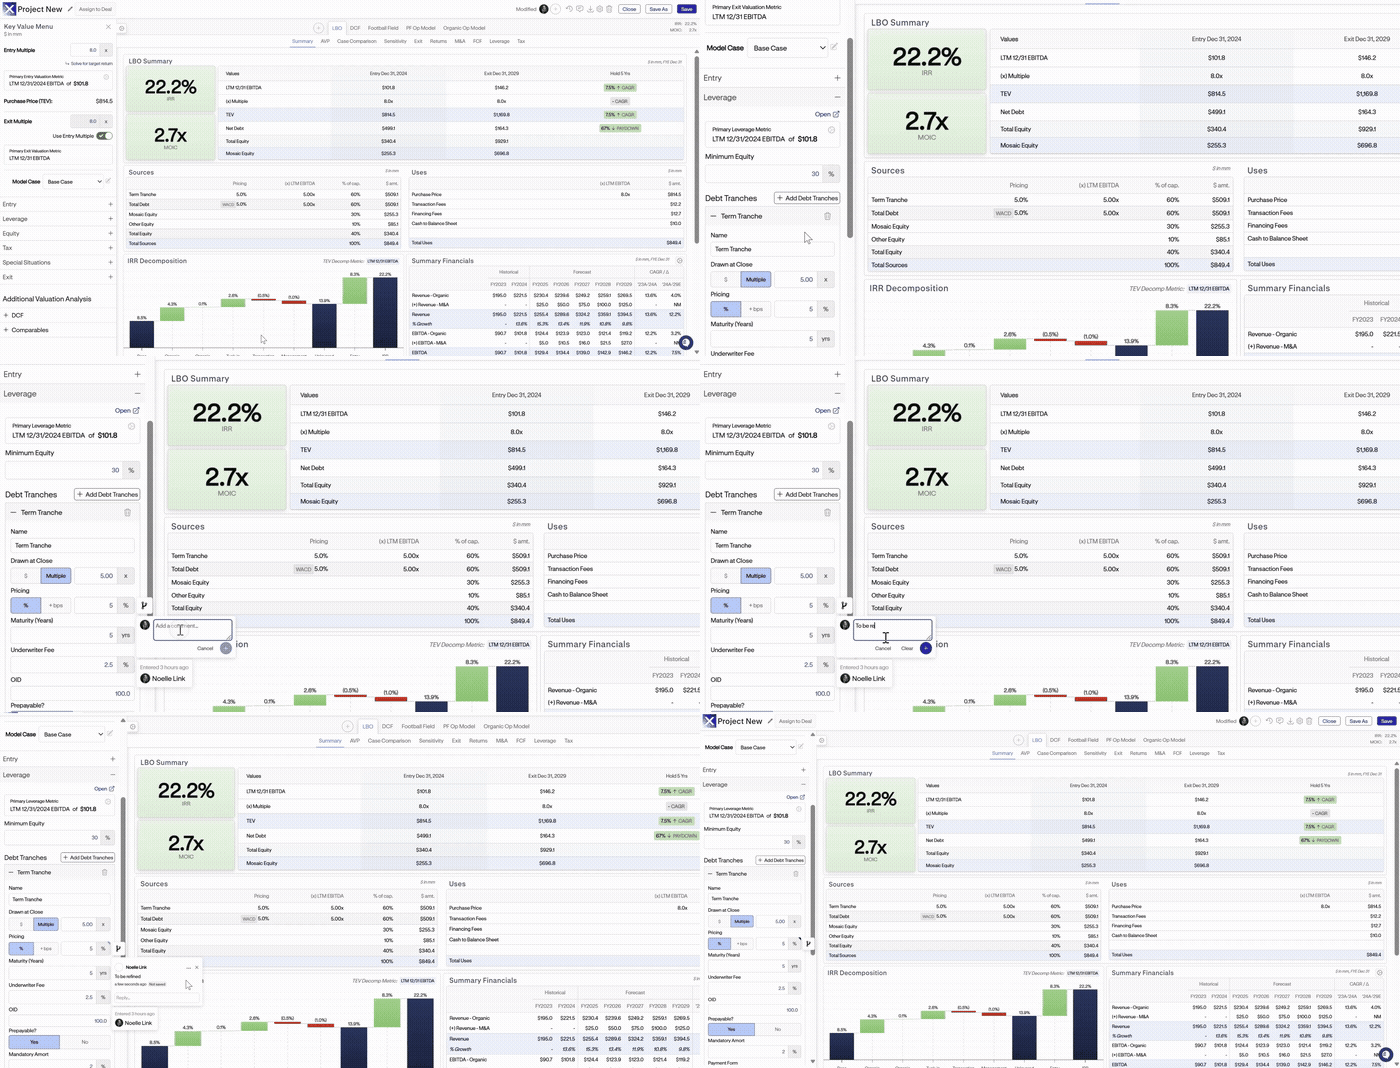
Mosaic now supports comments across the platform, allowing team members to leave contextual notes directly within models. This update makes it easier to flag questions, explain assumptions, or leave feedback without leaving the platform.
Deterministic
Models, Enhanced by AI
Learn more about how AI is selectively integrated into Mosaic’s deterministic modeling platform
Built for Enterprise Trust
Protecting your data is core to how Mosaic is built. Mosaic is enterprise-ready and secure by design.
By the Numbers
Experience the platform live
Reach out to learn how finance professionals worldwide are leveraging Mosaic to work more efficiently.
.avif)